VISU
product page: www.tritik.com/product/visu
version: 1.2.1
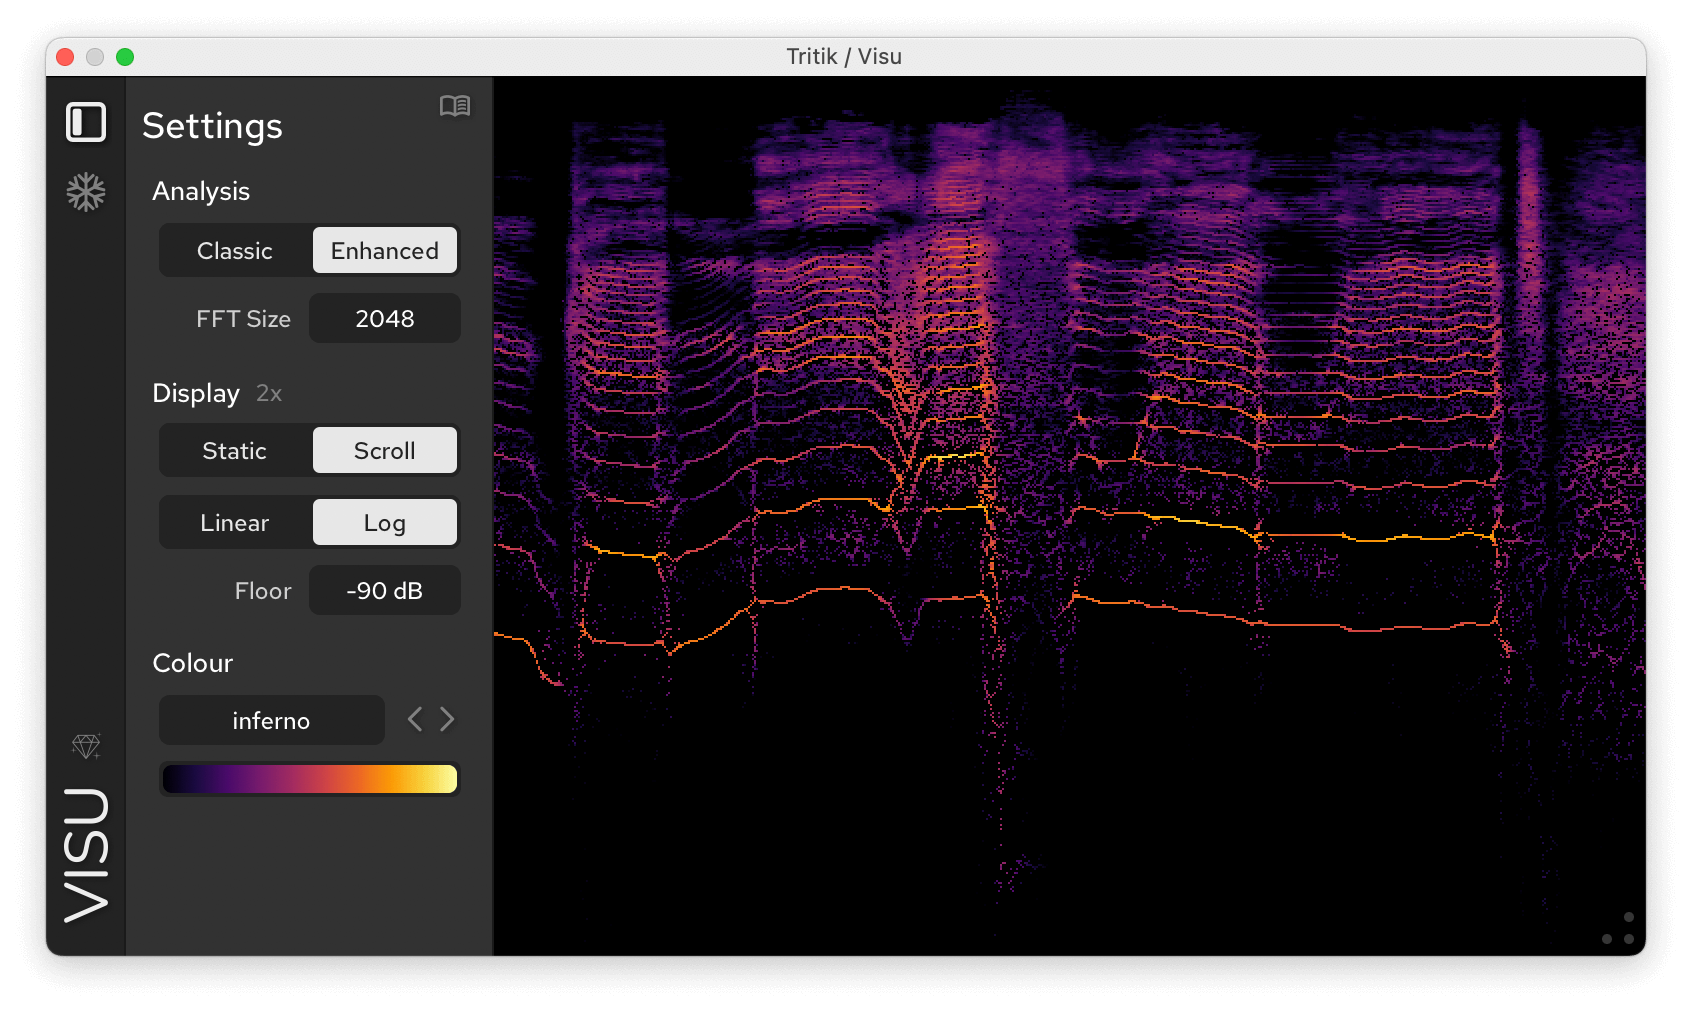
Table of Contents
New Features
v1.2.1
- Set Preset as Default menu option (not available in AAX).
v1.2.0
- Mel, Bark, and ERB frequency scales
- Option to display a piano keyboard on the frequency ruler.
- Auto Pause mode (pauses display according to the DAW playhead).
v1.1.0
- Burger menu with presets save/recall options.
- Speed control.
- Min & Max Frequencies controls.
- Frequency ruler.
- Ceiling control.
- Right-click menu for quick access to actions.
1. Overview
Visu is an advanced spectrogram plugin for detailed audio analysis and visualisation.
A spectrogram displays how the frequency content of a signal changes over time, with amplitude represented by colour. Think of it as an audio X-ray, useful for spotting transients, analyzing pitch and harmonics, detecting unwanted noise, and tracking how a sound evolves.
Alongside a classic spectrogram mode, Visu offers an enhanced mode with greater precision in both time and frequency. It uses time-frequency reassignment (a technique that relocates energy to its most accurate position using phase information) resulting in sharper transients, clearer pitches, and a more detailed image.
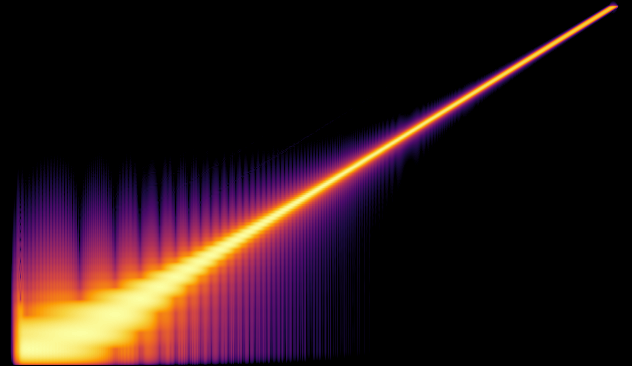
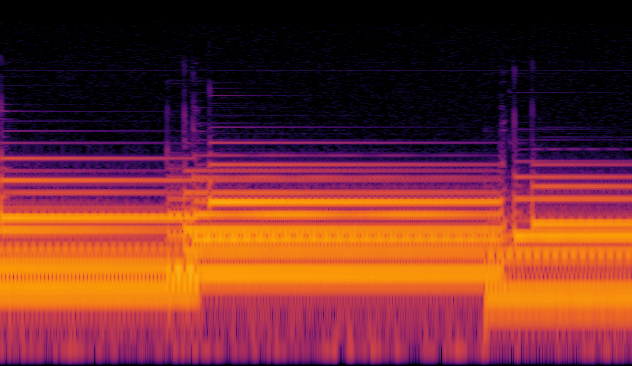
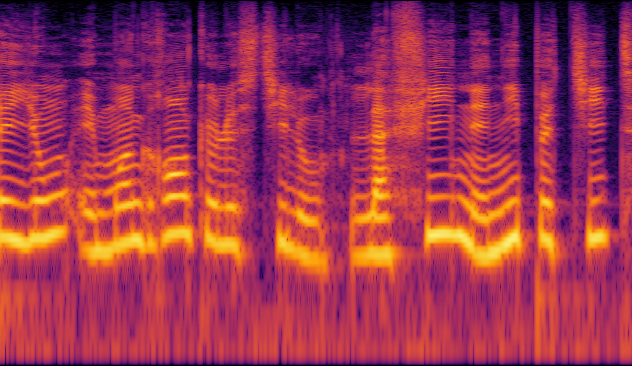
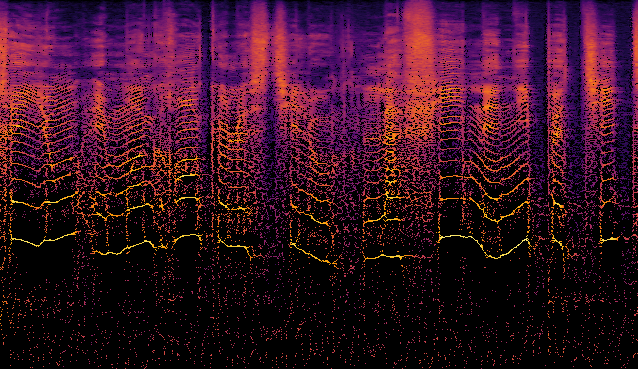
Below are the spectrograms in both classic and enhanced modes of different sounds (2048 samples FFT size; log frequency scale).
Sweep:

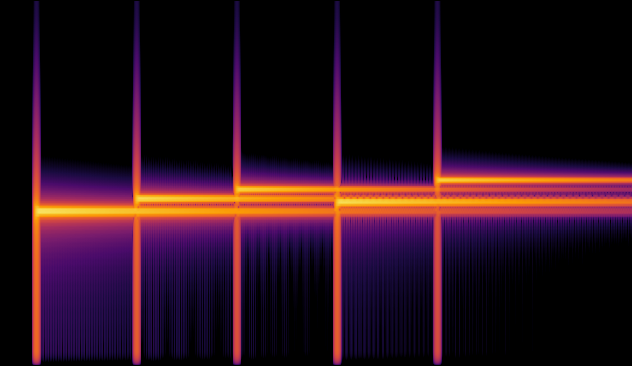
Synthetic Chime:
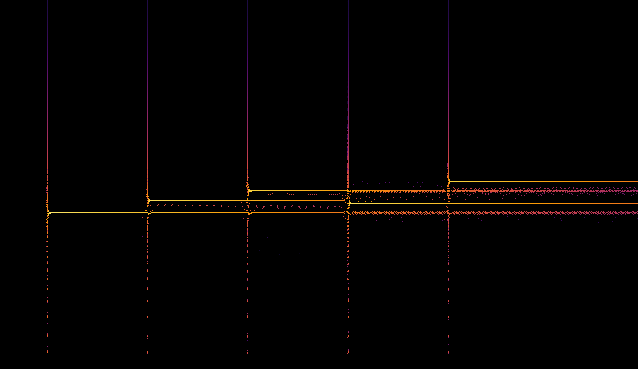
Rhodes Piano:

Voice:
2. Installation
After downloading from www.tritik.com/product/visu,
unzip the files and run the installer.
During installation, select the desired plugin formats (AU, VST3,
AAX).
Once installed, you can load Visu directly within your DAW.
2.1 System Requirements
Windows
- Windows 10 (64-bit) or Windows 11 (64-bit)
- Dual-core processor (10th Gen Intel or newer recommended)
- 4 GB RAM (8 GB recommended)
- 1280×720 display resolution or higher
- Windows-compatible audio interface
macOS
- macOS 10.15 (Catalina) or later (including macOS 11–15)
- Dual-core processor (Apple Silicon recommended)
- 4 GB RAM (8 GB recommended)
2.2 Licence & Activation
Visu is free and fully functional in black-and-white with no licence required.
You can access colour maps when you purchase a licence.
Registration
After purchasing a licence at www.tritik.com/product/visu :
- Click the diamond icon (💎) in the sidebar.
- Click Import Licence.
- Locate your licence file (
visu-license.tkk). - Visu confirms activation and colour palettes become available immediately.
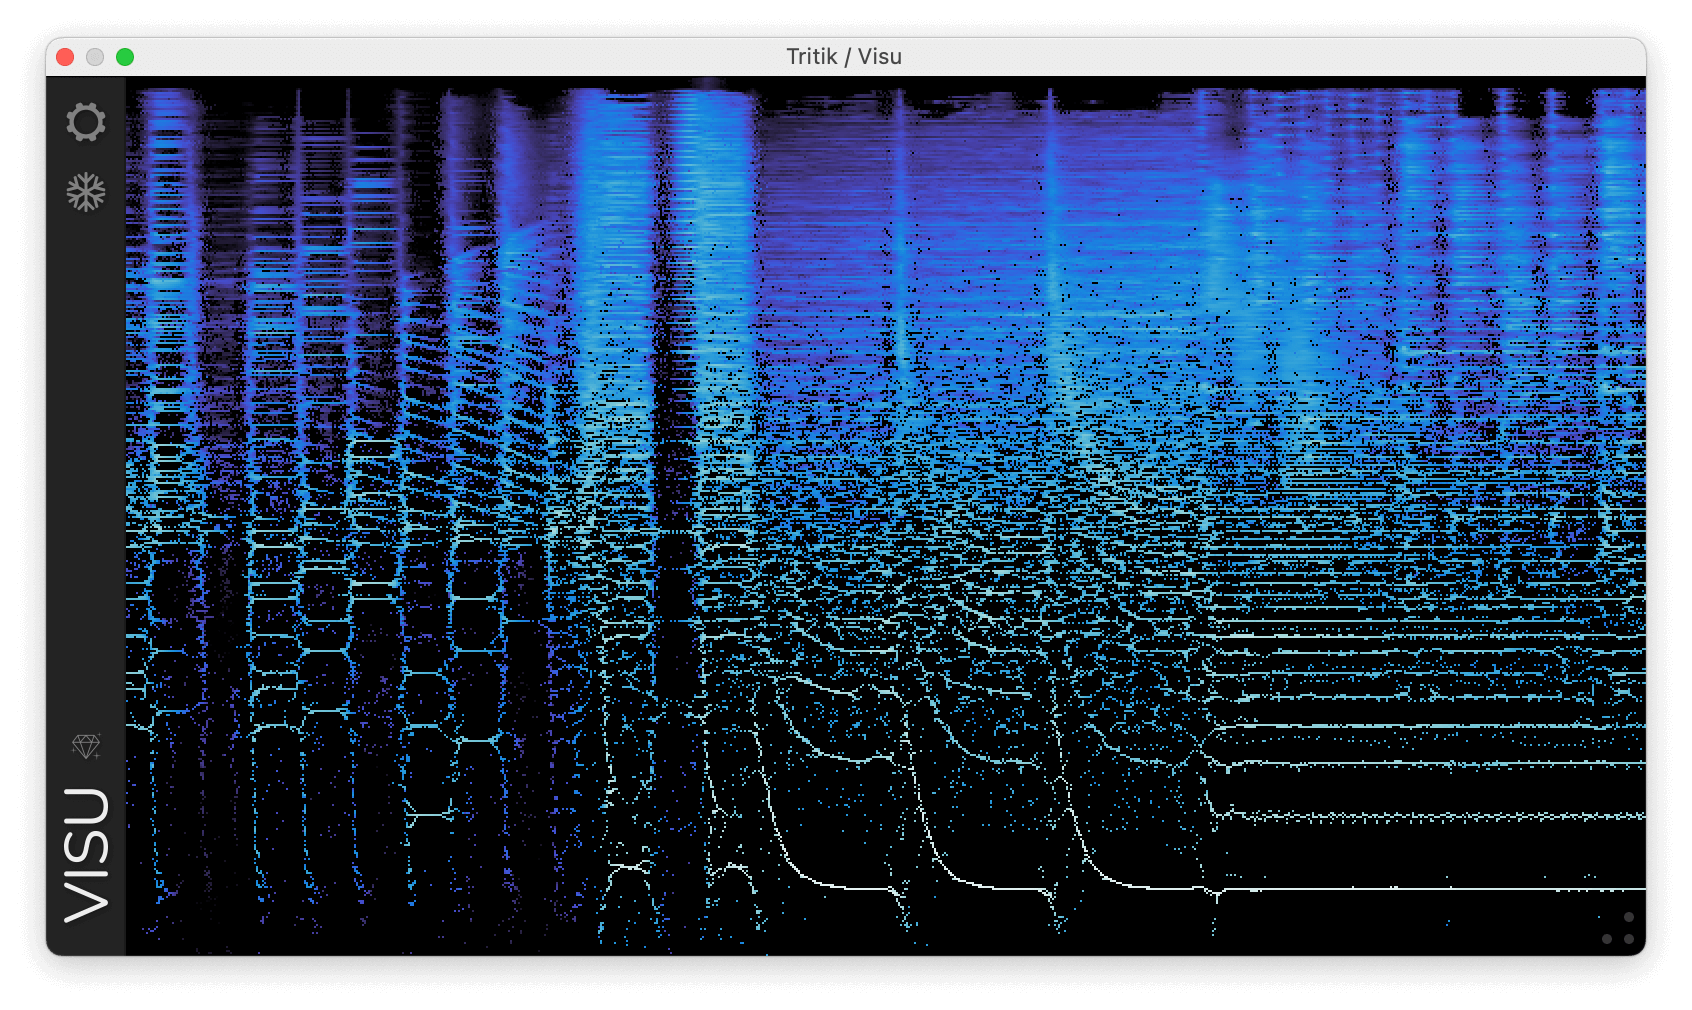
3. Views
Visu has 3 different views:
Standard View
Default layout with the main spectrogram area and sidebar.
Settings View
Access by clicking the gear icon of the sidebar. This View contains the Settings panel.
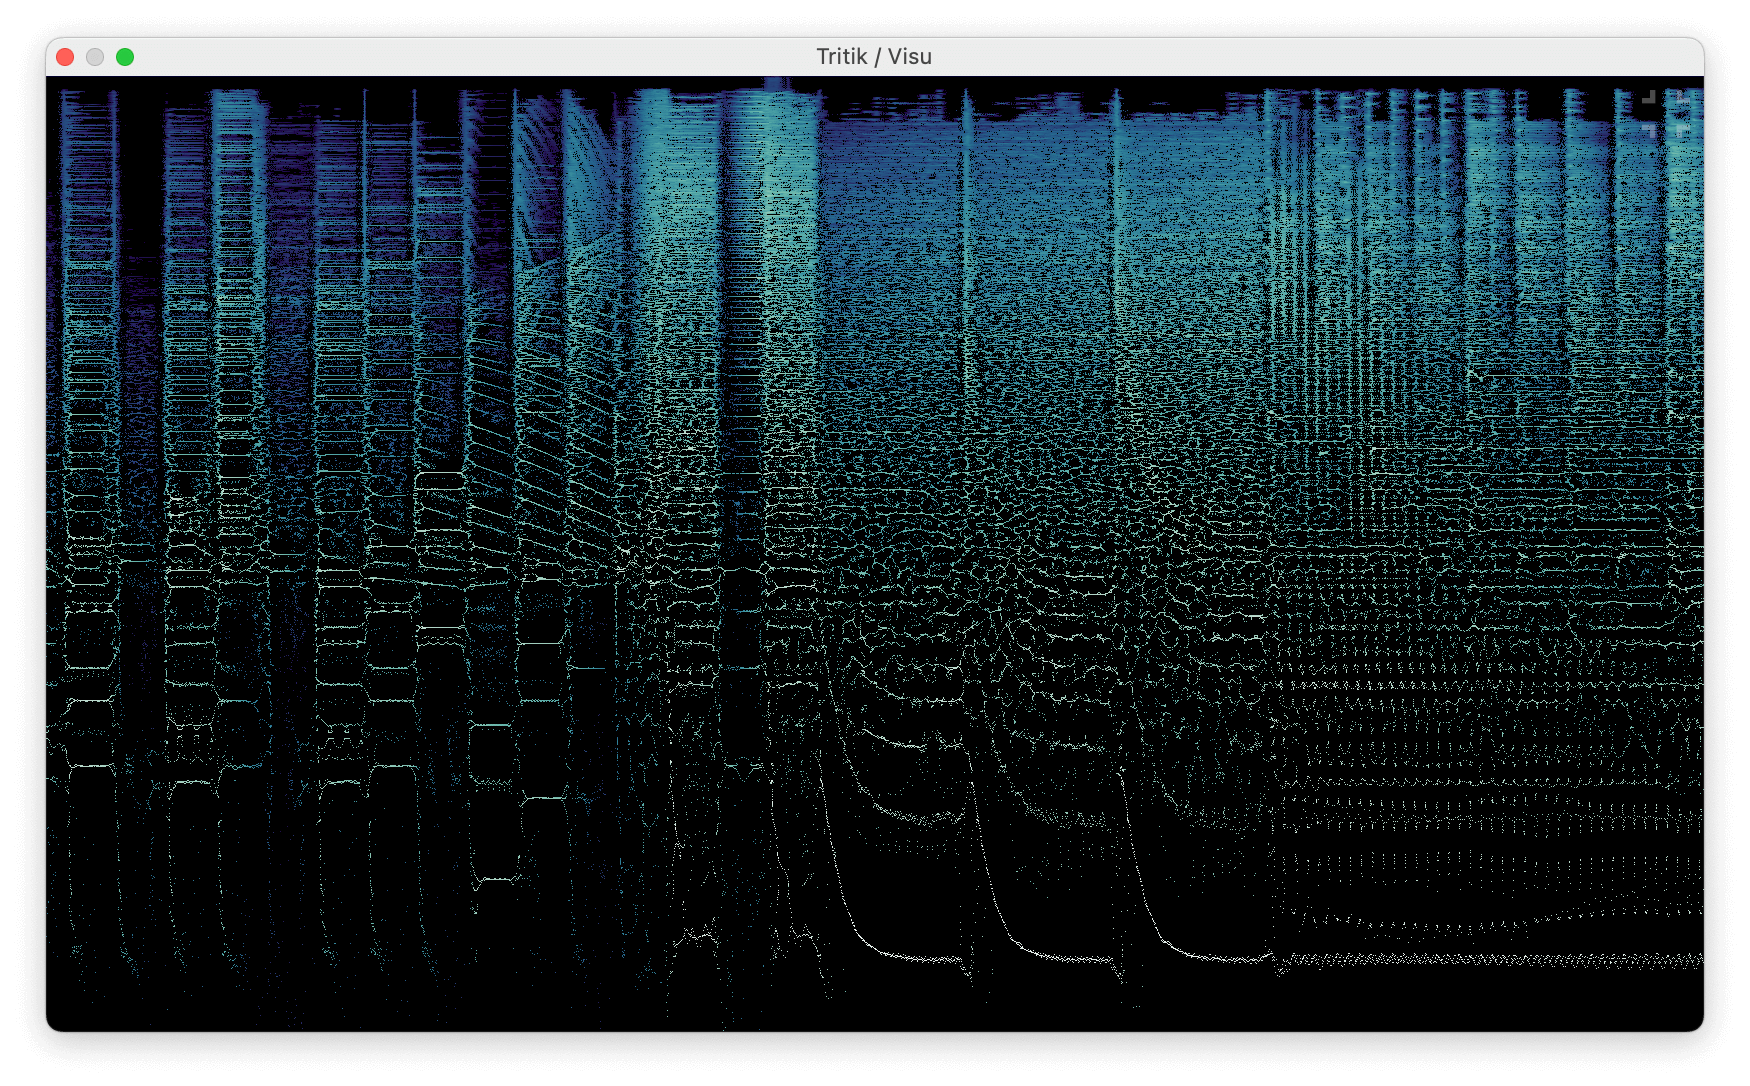
Full View
Activated by clicking the top-right icon.
This view displays only the spectrogram and allows free resizing
without aspect ratio constraints (drag the bottom right corner to
resize).
Click the icon again to return to the standard view.
4. Controls
4.1 Sidebar
Note that the sidebar is not visible in Full View.
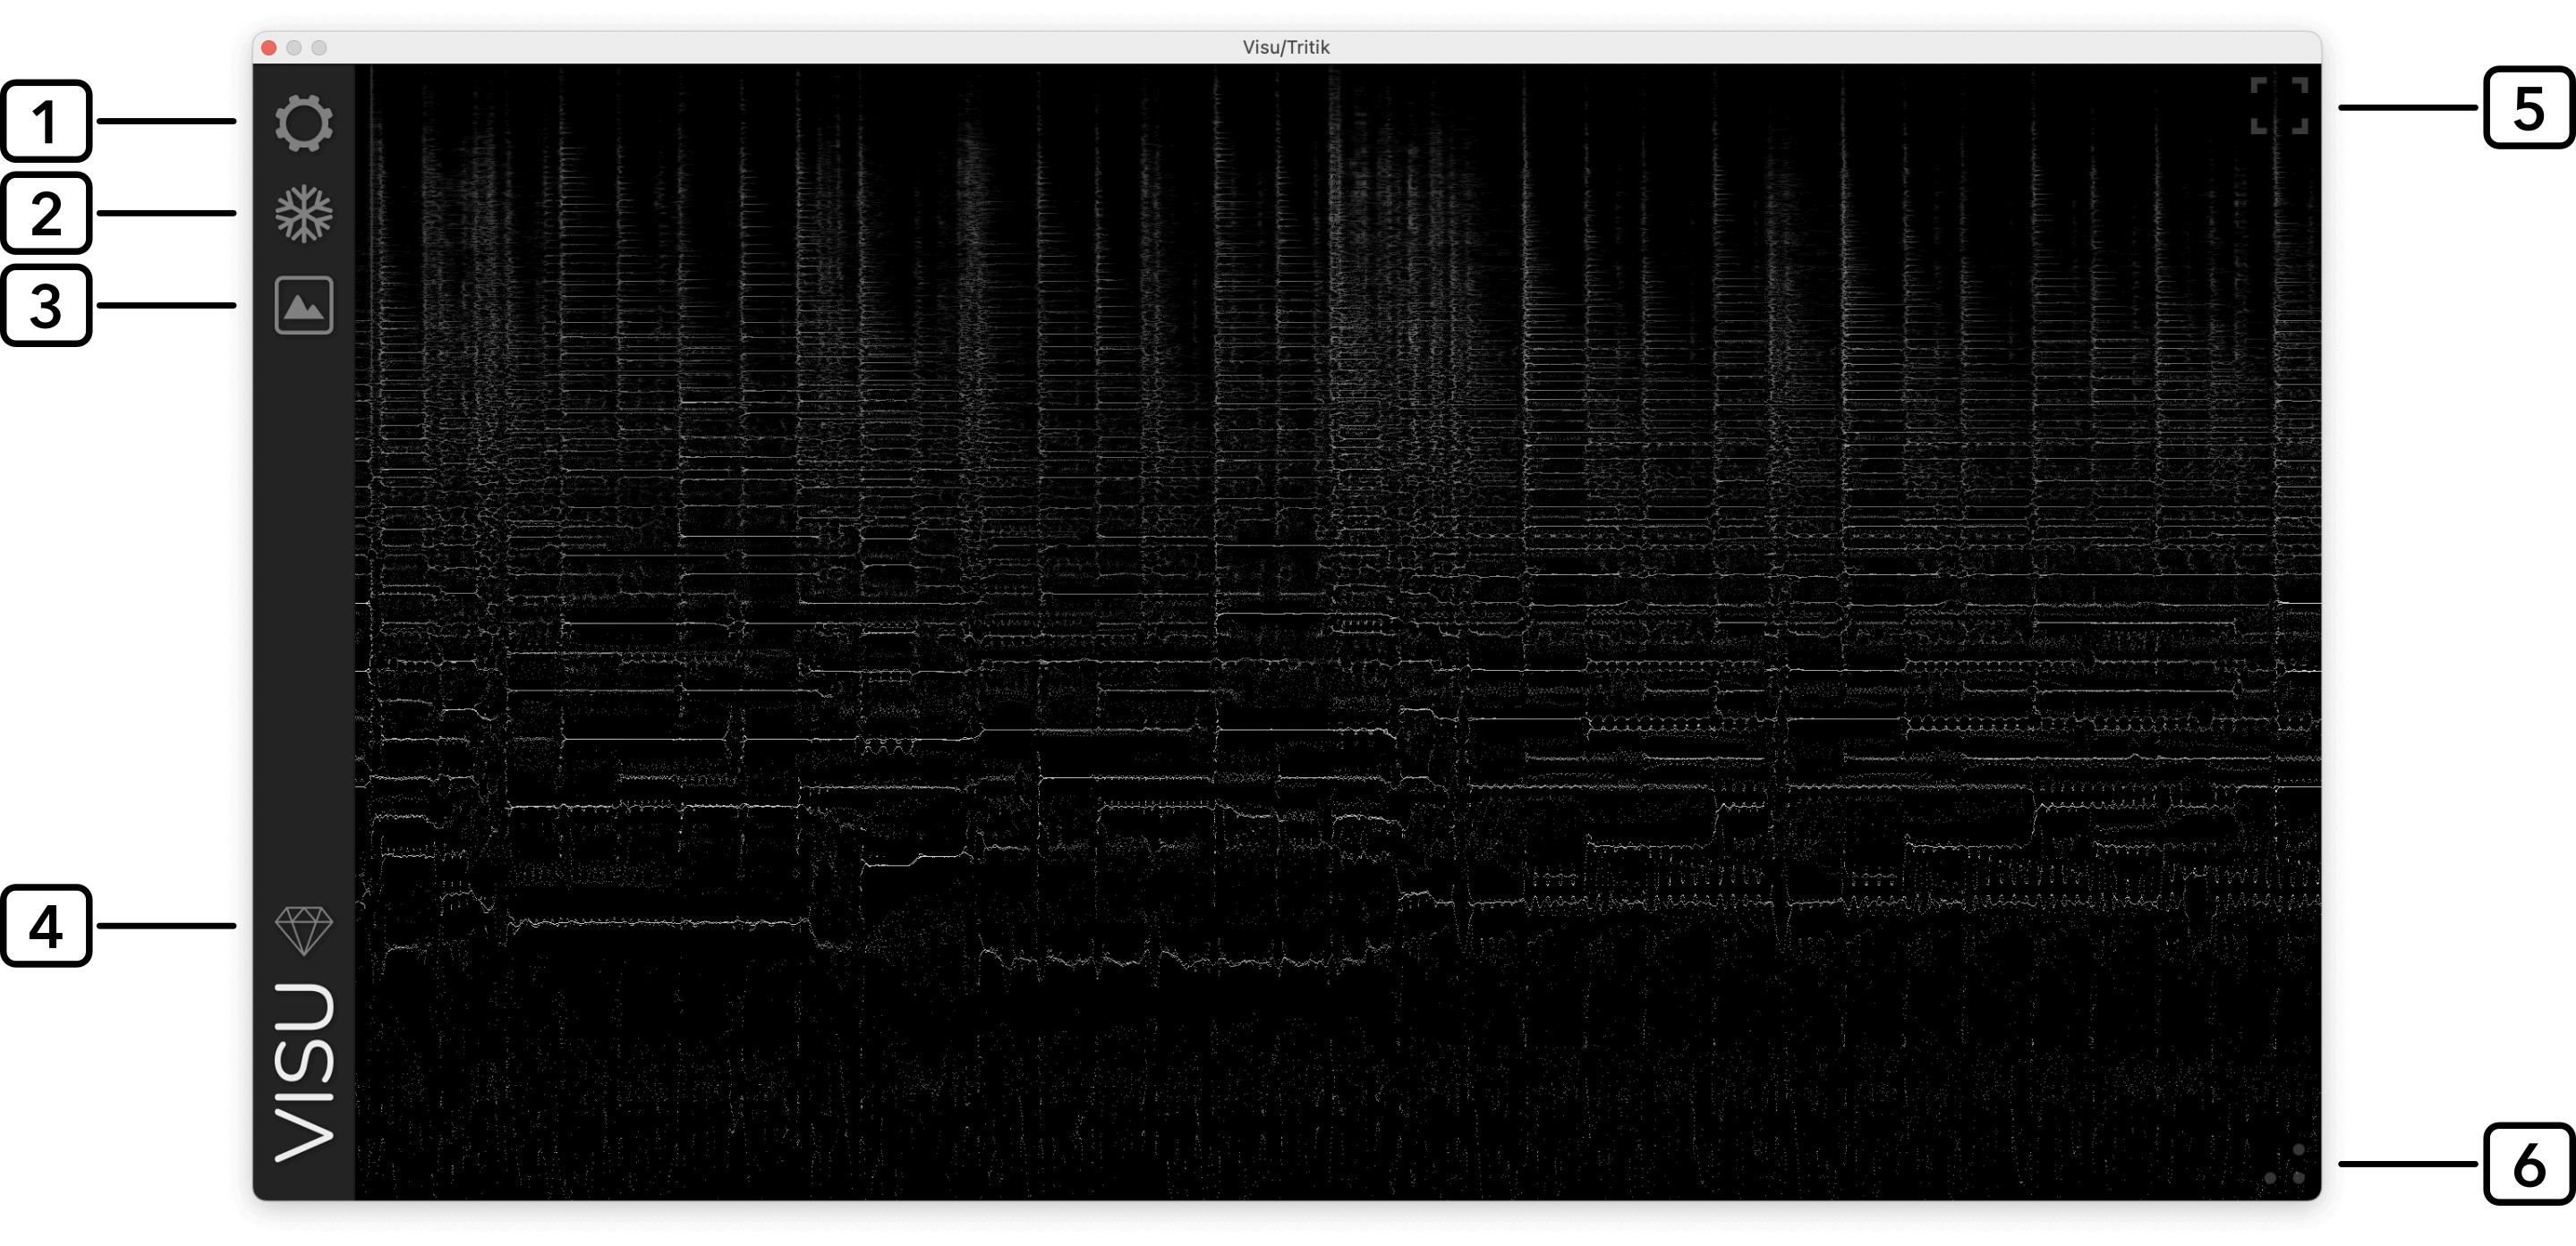
- Gear Icon: Open the settings panel.
- Freeze: Pause the spectrogram (or use shift+click).
- Export the spectrogram as a PNG image (only available when the spectrogram is frozen).
- Diamond Icon: Open the Licence Registration dialog.
- Full View toggle (top-right icon on hover).
- Resize Handle. Click and drag to adjust size.
4.2 Settings

1. Presets
Click the burger button (☰) to open a menu
that allows you to save the current settings,
recall a previously saved preset, or select
Init to reset all parameters to their default
values.
Use Set Preset as Default to make the selected
preset the default preset loaded by Visu (this option is not
available in AAX format).
You can also access this manual from the same menu.
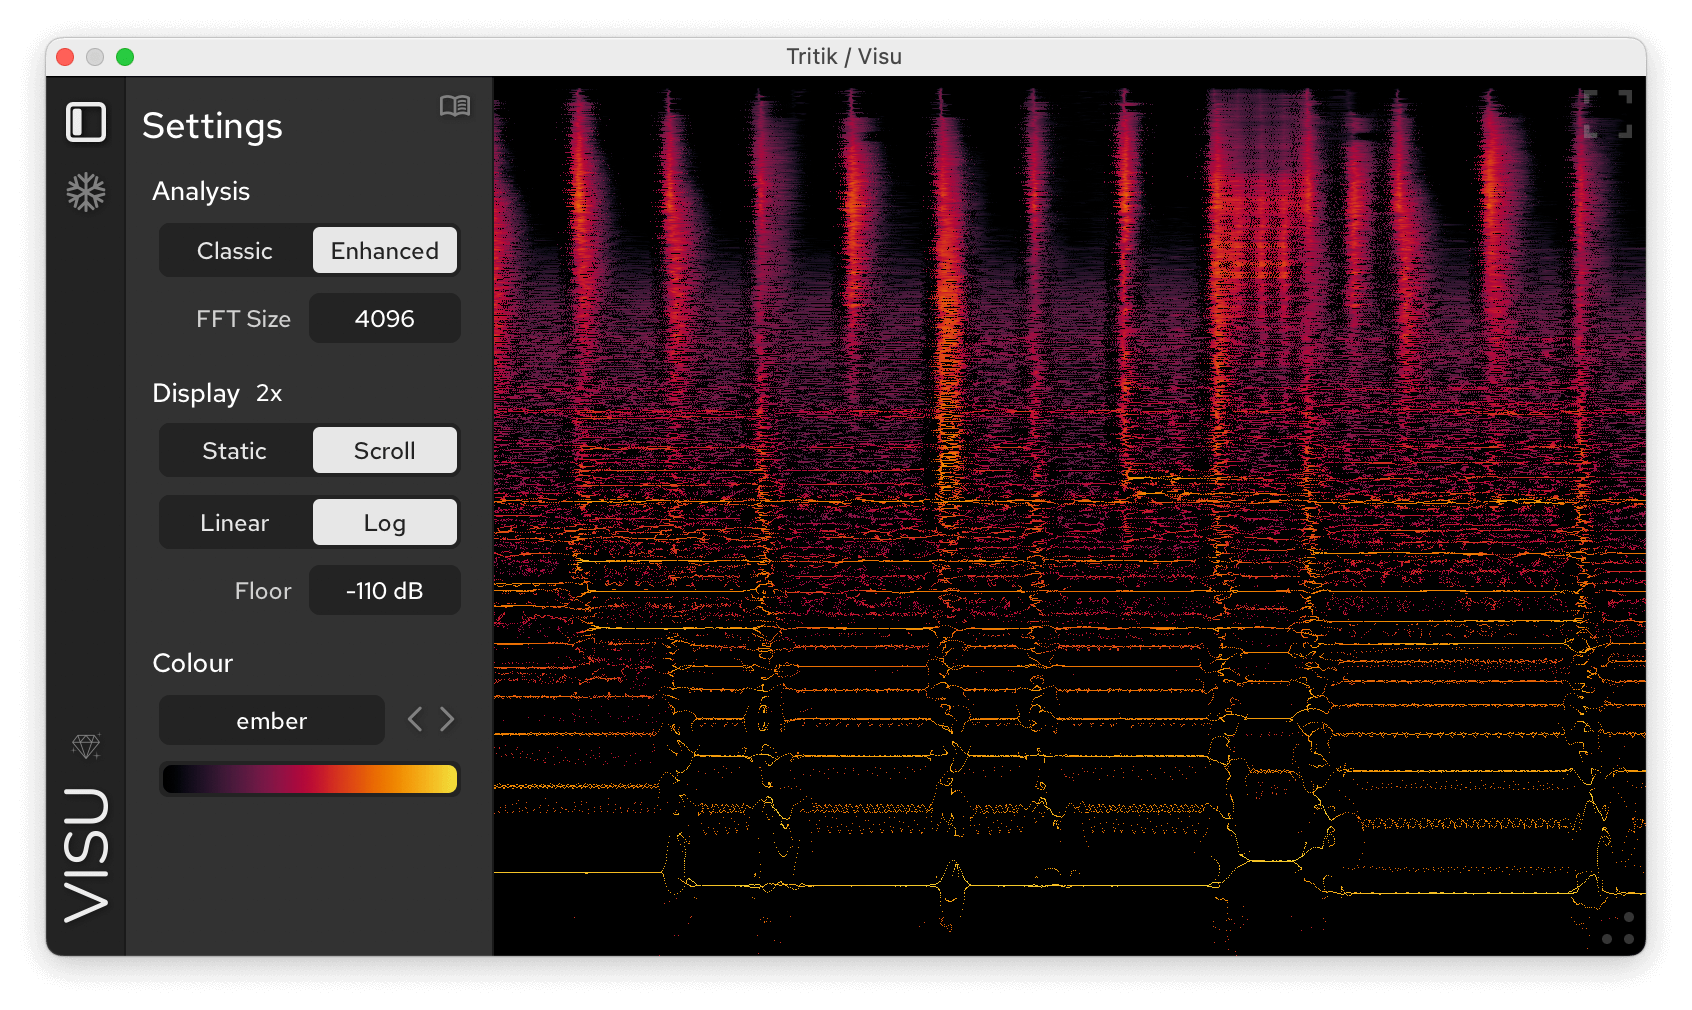
2. Analysis Mode
Select the analysis engine:
Classic: Standard spectrogram representation. Uses standard Short-Time Fourier Transforms (STFT), suitable for general-purpose audio analysis.
Enhanced: Uses ‘time-frequency reassignment’ methods to recalculate frequencies and timings. This mode provides improved precision in both time and frequency dimensions, sharpening spectral details and transients.
3. FFT Size
Determines how many samples are used for each frequency
analysis (FFT).
This setting controls the trade-off between frequency resolution
and time resolution.
Larger FFT Size: longer time window, providing finer frequency resolution to clearly distinguish close frequencies and accurately analyze harmonic structures. However, this also leads to reduced temporal precision.
Smaller FFT Size: shorter time window, delivering greater temporal resolution to accurately capture transient events and rhythmic details. The trade-off is coarser frequency resolution.
4. HiDPI Mode
On high-resolution screens, a 2x badge appears
next to the ‘Display’ label. Clicking it enables HiDPI mode, which
takes advantage of subpixel rendering for greater visual
precision.
Enabled: Renders the spectrogram more sharply and with finer detail.
Disabled: Uses standard pixel rendering, which gives a thicker appearance but can be easier to read and preferred by some users.
Note that the hiDPI mode requires some extra processing power.
5. Draw Mode
Static Mode: The spectrogram is drawn from
left to right, looping over itself without scrolling.
Scroll Mode: Scrolls new spectral data from right
to left.
Auto-Pause: When enabled, the display automatically pauses when the DAW transport stops, and resumes when playback starts.
6. Frequency Scale & Rulers
Scale
The scale controls how the vertical axis of the spectrogram maps to audio frequencies:
Linear: Maps frequencies evenly along the vertical axis, so that each hertz occupies the same amount of space. Great for percussive sounds, noise, and textures that span the full frequency range.
Log: This scale reflects how we perceive sound: low frequencies are expanded, and highs are compressed. Ideal for examining tones, harmonics, and detailed frequency content.
Mel: Refines the logarithmic scale using psychoacoustic data, so that equal distances correspond to equal perceived pitch differences.
Bark: Another perceptual scale that follows how the ear responds to different frequency regions.
ERB: Uses the Equivalent Rectangular Bandwidth scale, another perceptual scale designed to closely match the ear’s frequency sensitivity.
Rulers
Click the piano icon to toggle the piano display on or off. The size and position of the keys automatically adapt to the selected frequency scale.
Click the ruler icon to toggle the frequency ruler on or off.
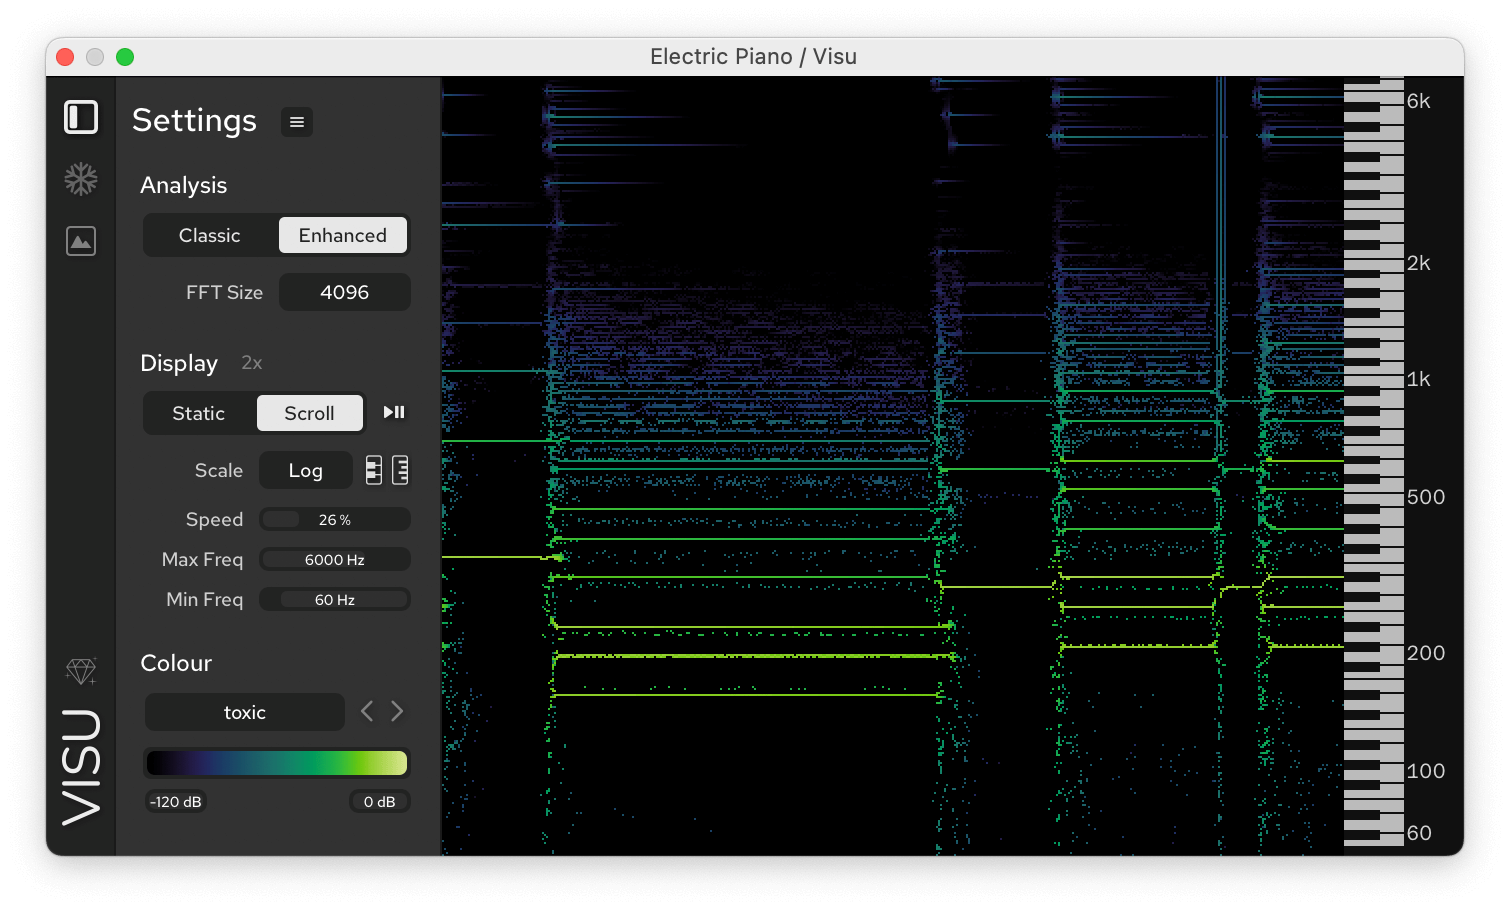
7. Speed
Sets the scrolling rate of the spectrogram. Lower values slow the scroll, higher values speed it up.
The Speed value can be clicked to enter an exact number or dragged for quick adjustment.
8. Min & Max Frequencies
Define the frequency range shown in the spectrogram. Only content between Min and Max is displayed, allowing you to focus on a specific frequency band.
Both controls can be clicked to enter an exact value or dragged for quick adjustment..
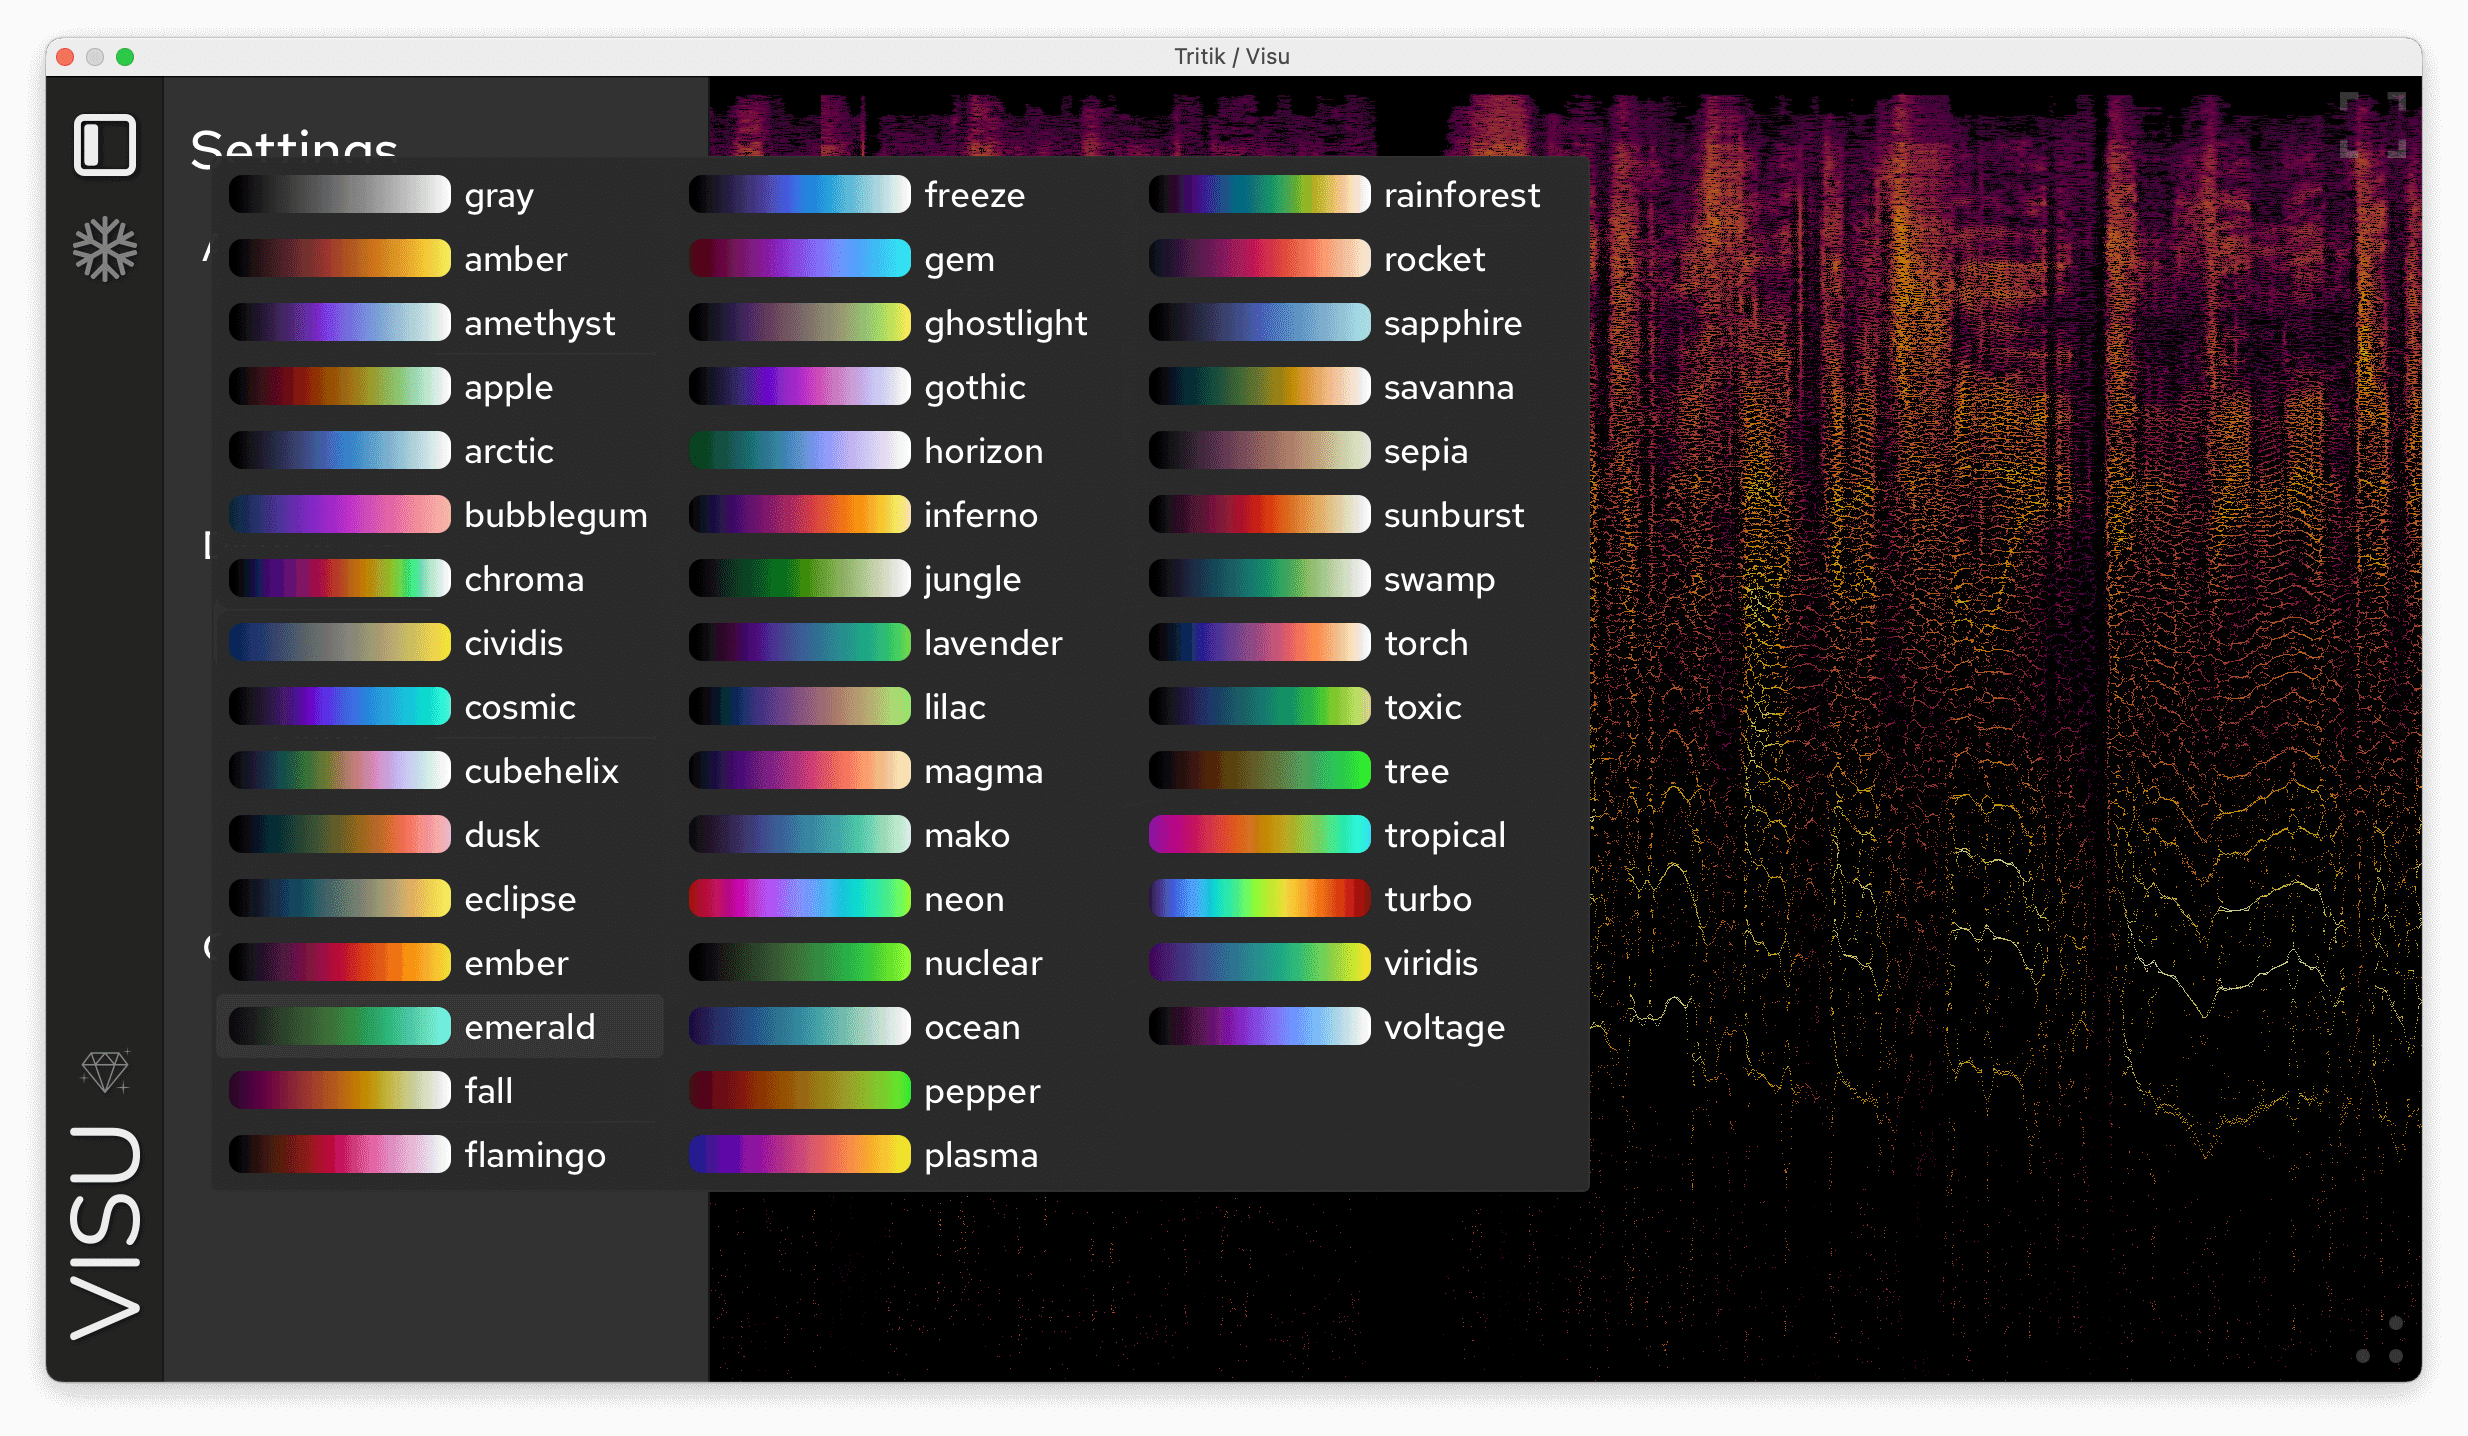
9. Colour Maps
Colour maps are available via licence. See 2.2 Licence & Activation.
Choose from 40+ spectrogram colour maps. Most of those maps were designed to be perceptually uniform and colour-vision deficiency friendly.
10. Floor & Ceiling
These two values define the amplitude window rendered by the colour map:
Floor: Sets the amplitude threshold below which audio signals are rendered as silence (dark background) on the spectrogram. Lowering the floor reveals quieter details, while raising it hides low-level content and highlights the loudest parts of the signal.
Ceiling: Sets the amplitude threshold above which audio signals reach the spectrogram’s brightest colour.
Both Floor and Ceiling values can be clicked to enter an exact number or dragged for quick adjustment.
4.3 Mouse Actions
Mouse interactions available in all views:
- Shift + Click: Toggle freeze mode.
- Click and drag: Show a tooltip showing the frequency under the cursor.

- Right-Click: Opens a menu for quick access to actions.

5. Credits
Design, DSP & GUI: Charles Gondre
Time-frequency reassignment algorithm based on research by P. Flandrin, F. Auger, et al.
Colour Maps:
- Magma, inferno, plasma and
viridis: Stéfan van der Walt and Nathaniel Smith.
- Cividis: Jamie R. Nuñez, Christopher R. Anderton, and
Ryan S. Renslow.
- Mako and rocket: Created for Python’s
Seaborn visualisation package.
- Turbo: Anton Mikhailov.
- Additional maps from Ellert van der Velden’s CMasher package.
Enjoy Visu!